BMS Reliability
Would it be useful to know how reliable a BMS is? How long before it should be upgraded? There is a whole branch of knowledge called Reliability Engineering that can help answer these questions.
The failure rate (λ) for a BMS is defined as the percentage of components failing per unit time. This varies throughout the BMS life. If λ is plotted versus time, we get the characteristic “bathtub” curve shown below.
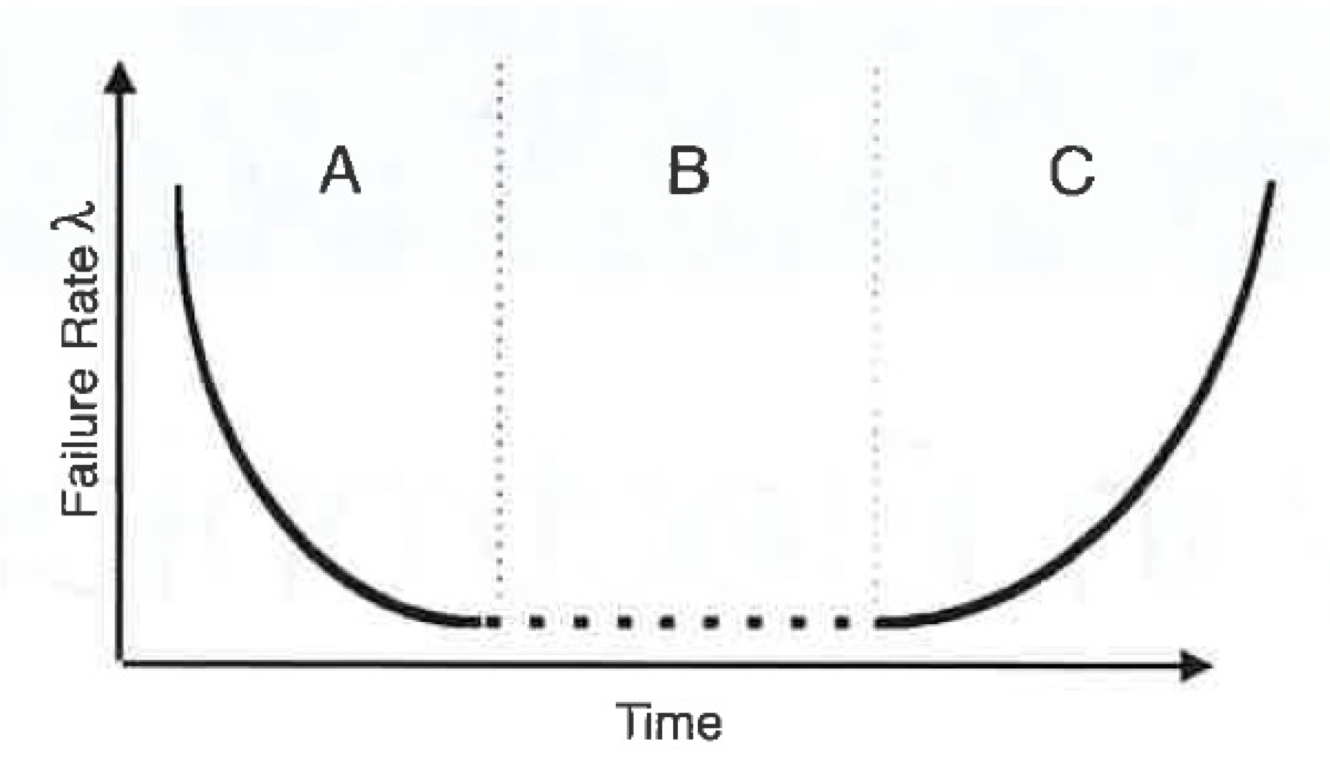
The curve has three regions:
A – Infant Mortality – When the product is initially launched, it faces a lot of failures.
B – Useful Life – The product stabilizes and faces constantly low failure rates.
C – Wear Out – The product starts facing a lot of failures due to nearing the end of its useful lifespan.
The Mean Time Between Failures (MTBF) is the inverse of the failure rate.
MTBF = 1/ λ
Reliability, R(t), is often defined as the probability that a piece of equipment operating under specified operating conditions shall perform satisfactorily for a given period of time.
It can be calculated using the following equation:
R(t) = e – λt = e -t/MTBF
The useful life of a BMS can be estimated using Weibull analysis. It informs us where the BMS is on the bathtub curve, and thus how much time before wear out will occur.
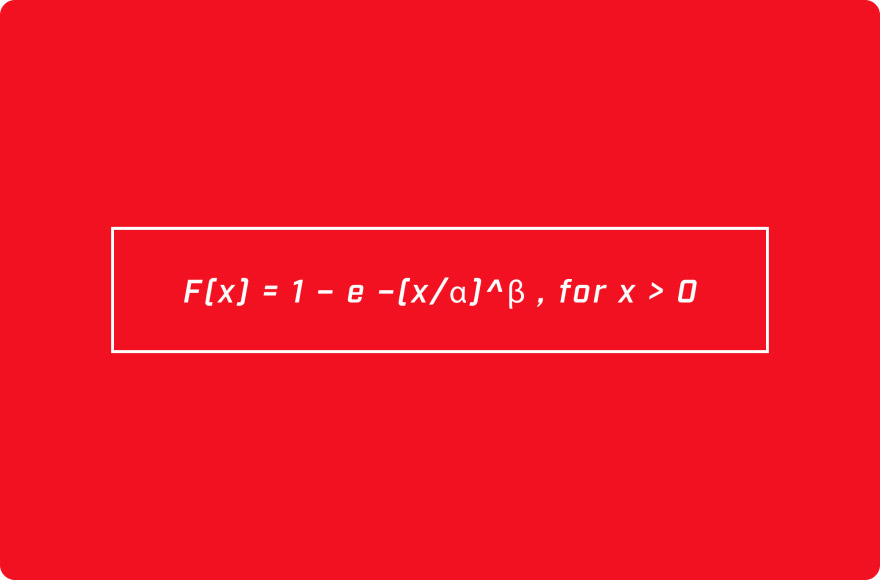
The two parameter Weibull analysis involves fitting the lifetime data of individual BMS units to the following cumulative distribution function:
F(x) = 1 – e –(x/α)^β , for x > 0
Where α represents the characteristic life of the BMS and β indicates where on the “bathtub” curve the BMS is.
Profire Energy offers PF2100 and PF3100 BMS solutions. To learn more about our products and solutions visit www.profireenergy.com.